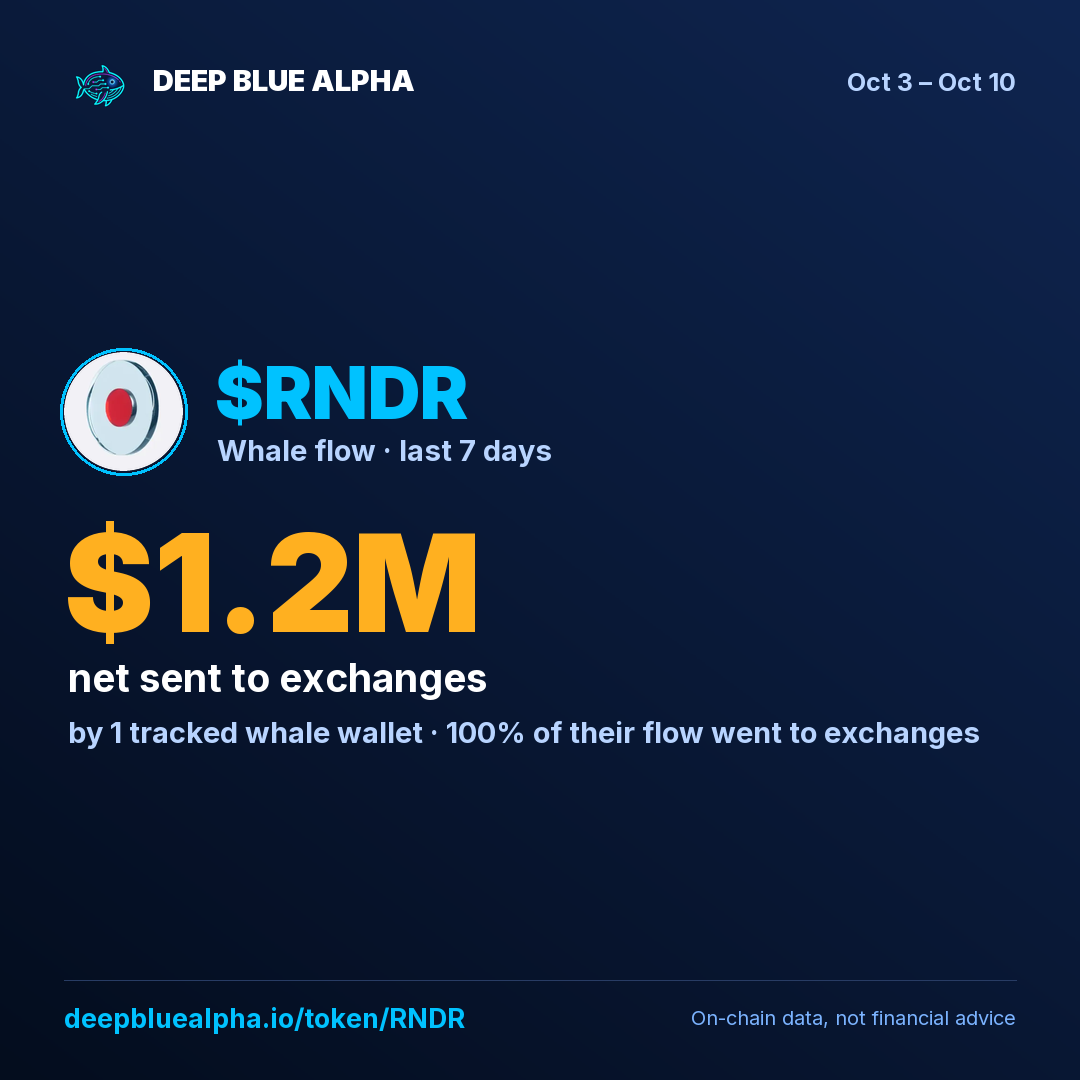
RNDR Whale Activity
Over the past 30 days, Deep Blue Alpha tracked 2 whale wallets moving RNDR, generating $2.5M in total whale volume across 5 whale moves. Accumulation-side flow totaled $1.2M against $1.3M distribution-side, a net $174.1K on the distribution side — a 46.5% accumulation share, indicating balanced positioning.
None of the tracked whale volume in RNDR over the last 30 days came from DEX trades; all of it was coins moving onto or off centralized exchanges. Whales withdrew $1.2M of RNDR from exchanges and deposited $1.3M — a 47% withdrawal share. Coins leaving exchanges is conventionally read as accumulation-side flow; coins arriving, as distribution-side. The largest single move was an exchange deposit of $1.2M on Oct 5. Whale moves were recorded on 2 of the last 30 days; the busiest was Oct 1, with $1.3M moved. In the last 7 days the withdrawal share was 0%, down from 47% across the full 30 days.
RNDR market data
via CoinGeckoSee which wallets are moving $RNDR
2 whale wallets moved $RNDR across 5 moves in the last 30 days.
- Wallet addresses, move sizes and entry prices
- Live feed of every exchange withdrawal, deposit and swap
- 30-day flow chart and conviction scores
What is RNDR?
Render Token (RNDR) is an Ethereum-based ERC-20 token that powers a decentralized GPU rendering network designed to democratize access to computational resources for 3D graphics and visual effects production. The RNDR token serves as the primary medium of exchange within the platform, enabling artists and studios to purchase rendering services while rewarding node operators who contribute processing power. The token has attracted substantial on-chain concentration, with significant capital deployments from institutional participants. Monitoring real-time whale wallet activity and RNDR accumulation patterns provides insight into sustained interest from major stakeholders on Deep Blue Alpha.
About RNDR Whale Tracking
Deep Blue Alpha tracked 2 distinct whale wallets moving RNDR on Ethereum over the last 30 days, generating 5 whale moves and $2.5M in total whale volume. Accumulation-side flow (exchange withdrawals + DEX buys) totaled $1.17M against $1.34M in distribution-side flow (exchange deposits + DEX sells), producing a net flow of $-174.1K — a 47.0% accumulation share, indicating balanced positioning.
The RNDR whale wallets are monitored in real-time across Uniswap V2/V3, CoW Protocol, 1inch, and other major Ethereum DEXs. Every RNDR exchange move and swap from a tracked whale wallet is captured within seconds of on-chain confirmation, classified by direction and size, and aggregated into the flow metrics above. The top whale wallets, recent trades, and historical flow charts on this page update continuously from live on-chain data.
This data reflects the Deep Blue Alpha tracked whale wallets only and is observational on-chain data. It is not financial advice, a trading signal, or a prediction of future price movement. Past whale wallet activity is not predictive of future results.
RNDR Whale Tracking FAQ
▸ What is the whale flow direction on RNDR?
Over the last 30 days, Deep Blue Alpha tracked a 47.0% accumulation share on RNDR — $1.2M in accumulation-side flow (exchange withdrawals + DEX buys) against $1.3M in distribution-side flow, a net flow of $-174.1K, indicating balanced positioning across the tracked whale wallets.
▸ How many whales are moving RNDR?
Deep Blue Alpha tracked 2 distinct whale wallets making 5 RNDR whale moves over the last 30 days, totaling $2.5M in whale volume. Moves include DEX swaps and exchange deposits/withdrawals.
▸ What is the 30-day whale net flow on RNDR?
The 30-day net whale flow on RNDR is $-174.1K, from $1.2M in tracked whale inflows and $1.3M in outflows.
▸ Where does Deep Blue Alpha track RNDR whale activity?
RNDR whale wallets are monitored in real time across Uniswap V2 and V3, CoW Protocol, 1inch, and other major Ethereum DEXs. Every tracked-whale RNDR exchange move and swap is captured within seconds of on-chain confirmation and classified by direction and size.
▸ Is RNDR whale data free to view?
Yes. Deep Blue Alpha is free to use with no signup required, and RNDR whale flow stats are shown on this page. Full whale leaderboards and individual whale moves are included free for top tokens and unlock on paid tiers for the complete tracked set.
▸ How often does RNDR whale data update?
RNDR whale moves are captured within seconds of on-chain confirmation and aggregated live, so the leaderboard and flow charts on this page reflect the latest tracked activity.
▸ What counts as a RNDR whale on Deep Blue Alpha?
Deep Blue Alpha classifies a whale by trade size and on-chain volume rather than token holdings. On RNDR, 2 such wallets met the threshold over the last 30 days.
Whale history · what followed
Past whale moves on RNDR that Deep Blue Alpha tracked, and how RNDR's price changed afterwards next to ETH over the same period.
| Date | Whale move | 1 day later | 7 days later | 30 days later |
|---|---|---|---|---|
| 2026-10-05 | $1.2M net deposited to exchanges | pending | pending | pending |
| 2026-10-02 | 2 tracked whales moved into the token ($1.1M) | +2.1% ETH +0.8% |
pending | pending |
Price change = where RNDR traded 1, 7 and 30 days after the move vs. when it happened, from tracked swaps. Historical record only — past moves are not indicative of future results. Not financial advice. Method & full record →